Not sure how to structure your Go web application?
My new book guides you through the start-to-finish build of a real world web application in Go — covering topics like how to structure your code, manage dependencies, create dynamic database-driven pages, and how to authenticate and authorize users securely.
Mid-year sale: 30% off until the end of July!
Take a look!
Occasionally I get asked “why do you like using Go?” And one of the things I often mention is the thoughtful tooling that exists alongside the language as part of the go command. There are some tools that I use everyday — like go fmt and go build — and others like go tool pprof that I only use to help solve a specific issue. But in all cases I appreciate the fact that they make managing and maintaining my projects easier.
In this post I hope to provide a little background and context about the tools I find most useful, and importantly, explain how they can fit into the workflow of a typical project. I hope it'll give you a good start if you're new to Go.
Or if you've been working with Go for a while, and that stuff's not applicable to you, hopefully you'll still discover a command or flag that you didn't know existed before 😊
The information in this post is written for Go 1.12 and assumes that you're working on a project which has modules enabled.
- Installing Tooling
- Viewing Environment Information
- Development
- Testing
- Pre-Commit Checks
- Build and Deployment
- Diagnosing Problems and Making Optimizations
- Managing Dependencies
- Upgrading to a New Go Release
- Reporting Bugs
- Cheatsheet
Installing Tooling
In this post I'll mainly be focusing on tools that are a part of the go command. But there are a few I'll be mentioning which aren't part of the standard Go 1.12 release.
To install these while using Go 1.12 you'll first need to make sure that you're outside of a module-enabled directory (I usually just change into /tmp). Then you can use the GO111MODULE=on go get command to install the tool. For example:
$ cd /tmp
$ GO111MODULE=on go get golang.org/x/tools/cmd/stress
This will download the relevant package and dependencies, build the executable and add it to your GOBIN directory. If you haven't explicitly set a GOBIN directory, then the executable will be added to your GOPATH/bin folder. Either way, you should make sure that the appropriate directory is on your system path.
Viewing Environment Information
You can use the go env tool to display information about your current Go operating environment. This can be particularly useful if you're working on an unfamiliar machine.
$ go env
GOARCH="amd64"
GOBIN=""
GOCACHE="/home/alex/.cache/go-build"
GOEXE=""
GOFLAGS=""
GOHOSTARCH="amd64"
GOHOSTOS="linux"
GOOS="linux"
GOPATH="/home/alex/go"
GOPROXY=""
GORACE=""
GOROOT="/usr/local/go"
GOTMPDIR=""
GOTOOLDIR="/usr/local/go/pkg/tool/linux_amd64"
GCCGO="gccgo"
CC="gcc"
CXX="g++"
CGO_ENABLED="1"
GOMOD=""
CGO_CFLAGS="-g -O2"
CGO_CPPFLAGS=""
CGO_CXXFLAGS="-g -O2"
CGO_FFLAGS="-g -O2"
CGO_LDFLAGS="-g -O2"
PKG_CONFIG="pkg-config"
GOGCCFLAGS="-fPIC -m64 -pthread -fmessage-length=0 -fdebug-prefix-map=/tmp/go-build245740092=/tmp/go-build -gno-record-gcc-switches"
If there are specific values that you're interested in, you can pass them as arguments to go env. For example:
$ go env GOPATH GOOS GOARCH
/home/alex/go
linux
amd64
To show documentation for all go env variables and values you can run:
$ go help environment
Development
Running Code
During development the go run tool is a convenient way to try out your code. It's essentially a shortcut that compiles your code, creates an executable binary in your /tmp directory, and then runs this binary in one step.
$ go run .          # Run the package in the current directory
$ go run ./cmd/foo  # Run the package in the ./cmd/foo directory
Fetching Dependencies
Assuming that you've got modules enabled, when you use go run (or go test or go build for that matter) any external dependencies will automatically (and recursively) be downloaded to fulfill the import statements in your code. By default the latest tagged release of the dependency will be downloaded, or if no tagged releases are available, then the dependency at the latest commit.
If you know in advance that you need a specific version of a dependency (instead of the one that Go would fetch by default) you can use go get with the relevant version number or commit hash. For example:
$ go get github.com/foo/[email protected]
$ go get github.com/foo/bar@8e1b8d3
If the dependency being fetched has a go.mod file, then its dependencies won't be listed in your go.mod file. In contrast, if the dependency you're downloading doesn't have a go.mod file, then it's dependencies will be listed in your go.mod file with an // indirect comment next to them.
So that means your go.mod file doesn't necessarily show all the dependencies for your project in one place. Instead, you can view them all using the go list tool like so:
$ go list -m all
Sometimes you might wonder why is that a dependency? You can answer this with the go mod why command, which will show you the shortest path from a package in your main module to a given dependency. For example:
$ go mod why -m golang.org/x/sys
# golang.org/x/sys
github.com/alexedwards/argon2id
golang.org/x/crypto/argon2
golang.org/x/sys/cpu
If you're interested in analyzing or visualizing the dependencies for your application, then you might want to also check out the go mod graph tool. There's a great tutorial and example code for generating visualizations here.
Lastly, downloaded dependencies are stored in the module cache located at GOPATH/pkg/mod. If you ever need to clear the module cache you can use the go clean tool. But be aware: this will remove the downloaded dependencies for all projects on your machine.
$ go clean -modcache
Refactoring Code
Chances are you're probably familiar with using the gofmt tool to automatically format your code. But it also supports rewrite rules that you can use to help refactor your code. I'll demonstrate.
Let's say that you have the following code and you want to change the foo variable to Foo so it is exported.
var foo int

func bar() {
    foo = 1
	fmt.Println("foo")
}
To do this you can use gofmt with the -r flag to implement a rewrite rule, the -d flag to display a diff of the changes, and the -w flag to make the changes in place, like so:
$ gofmt -d -w -r 'foo -> Foo' .
-var foo int
+var Foo int

 func bar() {
-	foo = 1
+	Foo = 1
 	fmt.Println("foo")
 }
Notice how this is smarter than a find-and-replace? The foo variable has been changed, but the "foo" string in the fmt.Println() statement has been left unchanged. Another thing to note is that the gofmt command works recursively, so the above command will run on all *.go files in your current directory and subdirectories.
If you want to use this functionality, I recommend running rewrite rules without the -w flag first, and checking the diff first to make sure that the changes to the code are what you expect.
Let's take a look at a slightly more complicated example. Say you want to update your code to use the new Go 1.12 strings.ReplaceAll() function instead of strings.Replace(). To make this change you can run:
$ gofmt -w -r 'strings.Replace(a, b, c, -1) -> strings.ReplaceAll(a, b, c)' .
In rewrite rules, single lowercase characters act as wildcards matching arbitrary expressions, and those expressions will be substituted-in in the replacement.
Viewing Go Documentation
You can view documentation for the standard library packages via your terminal using the go doc tool. I often use this during development to quickly check something — like the name or signature of a specific function. I find it faster than navigating the web-based documentation and it's always available offline too.
$ go doc strings            # View simplified documentation for the strings package
$ go doc -all strings       # View full documentation for the strings package
$ go doc strings.Replace    # View documentation for the strings.Replace function
$ go doc sql.DB             # View documentation for the database/sql.DB type
$ go doc sql.DB.Query       # View documentation for the database/sql.DB.Query method
You can also include the -src flag to display the relevant Go source code. For example:
$ go doc -src strings.Replace # View the source code for the strings.Replace function
Testing
Running Tests
You can use the go test tool to run tests in your project like so:
$ go test .          # Run all tests in the current directory
$ go test ./...      # Run all tests in the current directory and sub-directories
$ go test ./foo/bar  # Run all tests in the ./foo/bar directory
Typically I run my tests with Go's race detector enabled, which can help pick up some of the data races that might occur in real-life usage. Like so:
$ go test -race ./...
It's important to note that enabling the race detector will increase the overall running time of your tests. So if you're running tests very frequently part of a TDD workflow, you might prefer to save using this for a pre-commit test run only.
Since 1.10, Go caches test results at the package-level. If a package hasn't changed between test runs — and you're using the same, cachable, flags for go test — then the cached test result will be displayed with a "(cached)" next to it. This is hugely helpful in speeding up the test runtime for large codebases. If you want force your tests to run in full (and avoid the cache) you can use the -count=1 flag, or clear all cached test results by using the go clean tool.
$ go test -count=1 ./...    # Bypass the test cache when running tests
$ go clean -testcache       # Delete all cached test results
You can limit go test to running specific tests (and sub-tests) by using the -run flag. This accepts a regular expression, and only tests which have names that match the regular expression will be run. I like to combine this with the -v flag to enable verbose mode, so the names of running tests and sub-tests are displayed. It's a useful way to make sure that I haven't screwed up the regexp and that the tests I expect are actually being run!
$ go test -v -run=^TestFooBar$ .          # Run the test with the exact name TestFooBar
$ go test -v -run=^TestFoo .              # Run tests whose names start with TestFoo
$ go test -v -run=^TestFooBar$/^Baz$ .    # Run the Baz subtest of the TestFooBar test only
A couple more flags that it's good to be aware of are -short (which you can use to skip long-running tests) and -failfast (which will stop running further tests after the first failure). Note that -failfast will prevent test results from being cached.
$ go test -short ./...      # Skip long running tests
$ go test -failfast ./...   # Don't run further tests after a failure.
Profiling Test Coverage
You can enable coverage analysis when running tests by using the -cover flag. This will display the percentage of code covered by the tests in the output for each package, similar to this:
$ go test -cover ./...
ok  	github.com/alexedwards/argon2id	0.467s	coverage: 78.6% of statements
You can also generate a coverage profile using the -coverprofile flag and view it in your web browser by using the go tool cover -html command like so:
$ go test -coverprofile=/tmp/profile.out ./...
$ go tool cover -html=/tmp/profile.out
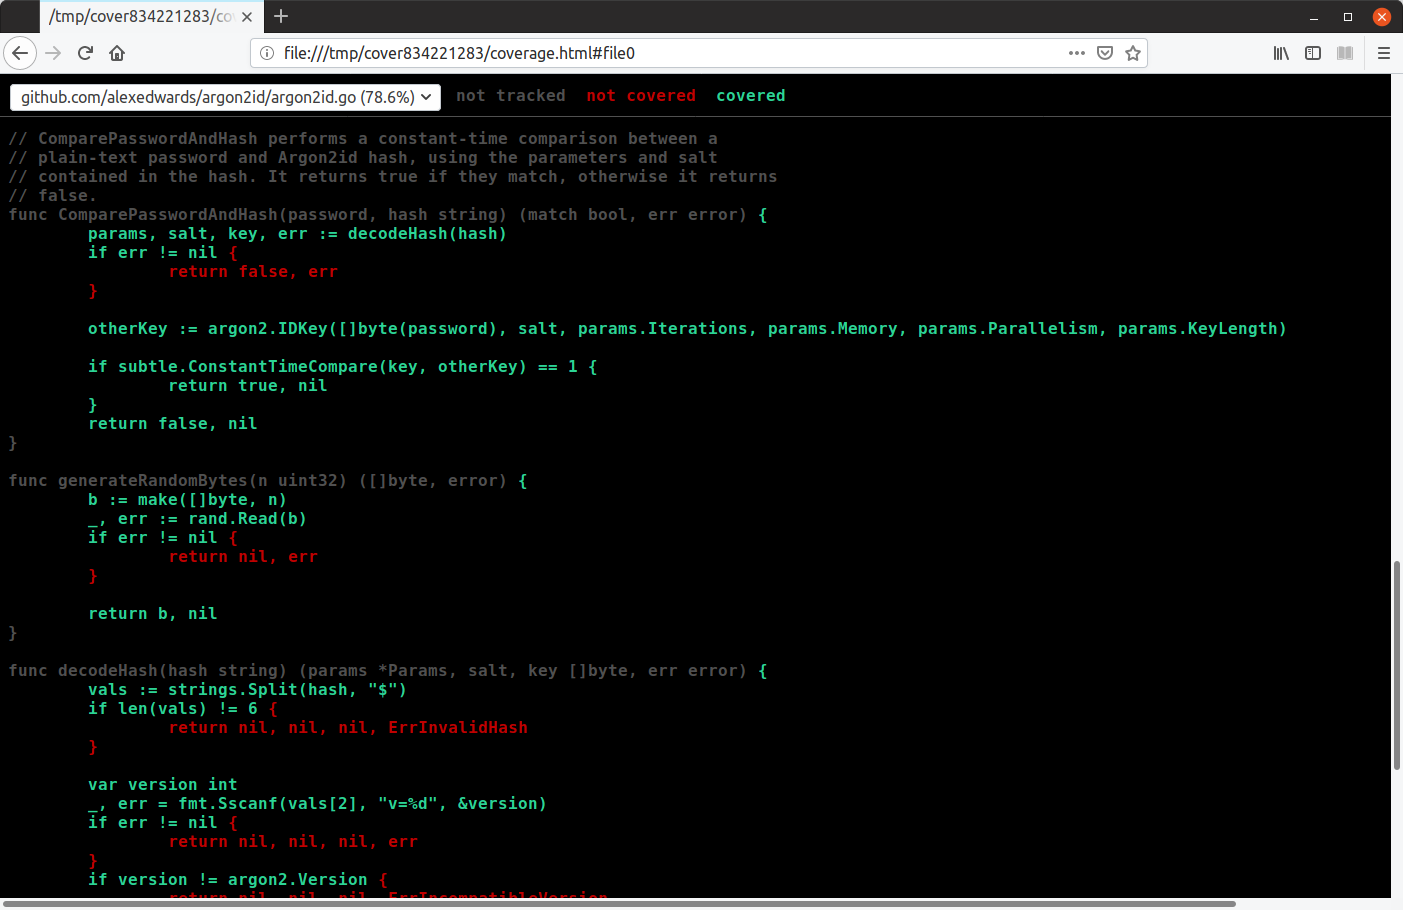
This will gives you a navigable listing of all the test files, with code covered by the tests displayed in green, and uncovered code in red.
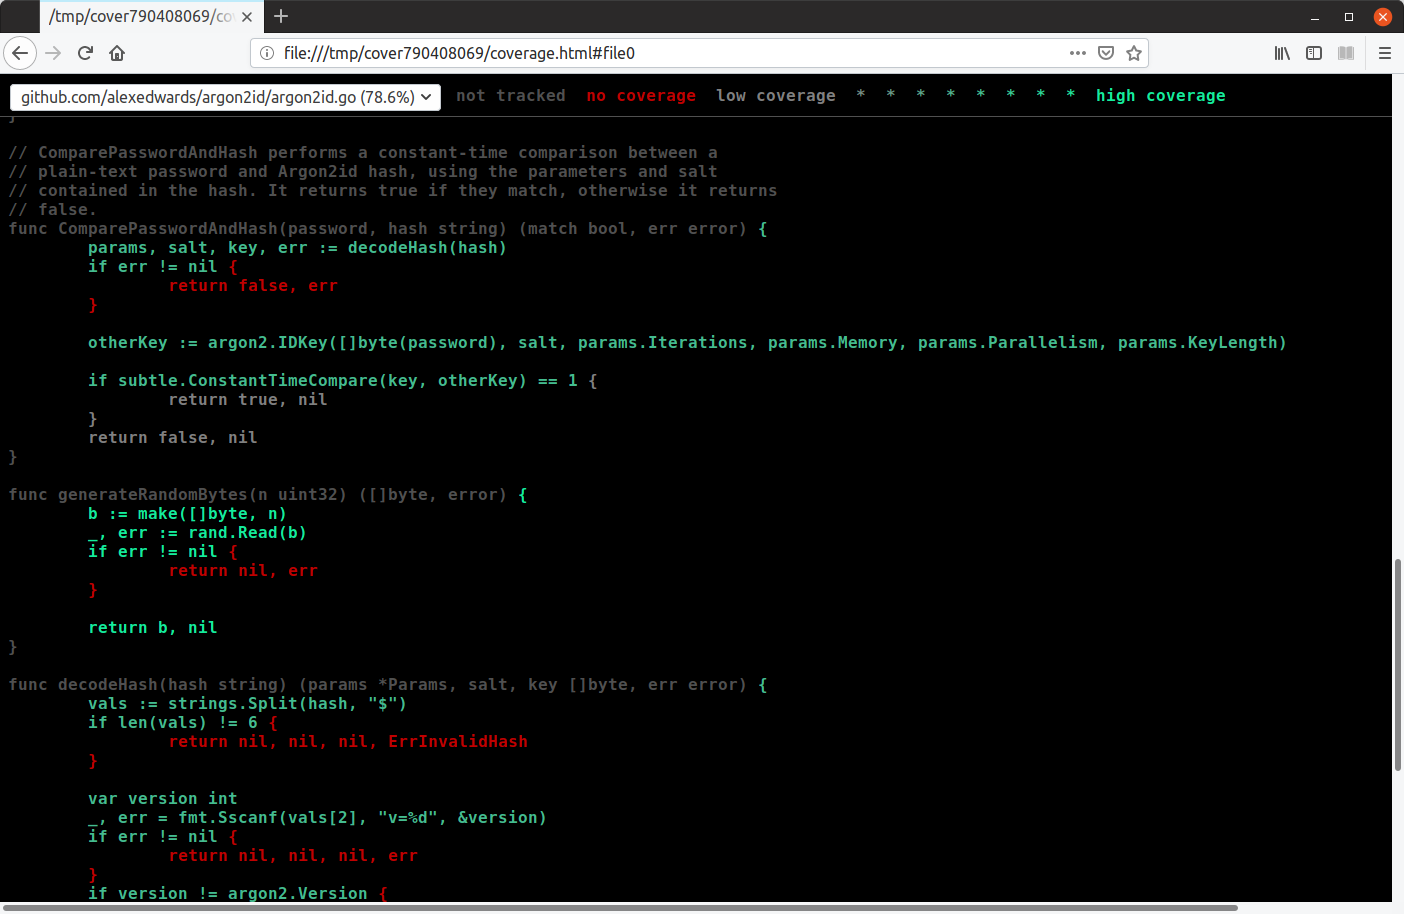
If you want you can go a step further and set the -covermode=count flag to make the coverage profile record the exact number of times that each statement is executed during the tests.
$ go test -covermode=count -coverprofile=/tmp/profile.out ./...
$ go tool cover -html=/tmp/profile.out
When viewed in the browser, statements which are executed more frequently are shown in a more saturated shade of green, similar to this:
Lastly, if you don't have a web browser available to view a coverage profile, you can see a breakdown of test coverage by function/method in your terminal with the command:
$ go tool cover -func=/tmp/profile.out
github.com/alexedwards/argon2id/argon2id.go:77:		CreateHash		87.5%
github.com/alexedwards/argon2id/argon2id.go:96:		ComparePasswordAndHash	85.7%
...
Stress Testing
You can use the go test -count command to run a test multiple times in succession, which can be useful if you want to check for sporadic or intermittent failures. For example:
$ go test -run=^TestFooBar$ -count=500 .
In this example, the TestFooBar test will be repeated 500 times in a row. But it's important to note that the test will be repeated in serial — even if it contains a t.Parallel() instruction. So if your test is doing something relatively slow, like making a round trip to a database, hard disk or the internet, running a large number of tests can take quite a long time.
In that case you might want to use the stress tool to repeat the same test multiple times in parallel instead. You can install it like so:
$ cd /tmp
$ GO111MODULE=on go get golang.org/x/tools/cmd/stress
To use the stress tool, you'll first need to compile a test binary for the specific package you want to test. You can do using the go test -c command. For example, to create a test binary for the package in your current directory:
$ go test -c -o=/tmp/foo.test .
In this example, the test binary will be outputted to /tmp/foo.test. You can then use the stress tool to execute a specific test in the test binary like so:
$ stress -p=4 /tmp/foo.test -test.run=^TestFooBar$
60 runs so far, 0 failures
120 runs so far, 0 failures
...
Testing all Dependencies
Before you build an executable for release or deployment, or distribute your code publicly, you may want to run the go test all command:
$ go test all
This will run tests on all packages in your module and all dependencies — include testing test dependencies and the necessary standard library packages — and it can help validate that the exact versions of the dependencies being used are compatible with each other. This can take quite a long time to run, but the results cache well so any subsequent tests should be faster in the future. If you want, you could also use go test -short all to skip any long-running tests.
Pre-Commit Checks
Formatting Code
Go provides two tools to automatically format your code according to the Go conventions: gofmt and go fmt. Using these helps keep your code consistent across your files and projects, and — if you use them before committing code — helps reduce noise when examining a diff between file versions.
I like to use the gofmt tool with the following flags:
$ gofmt -w -s -d foo.go  # Format the foo.go file
$ gofmt -w -s -d .       # Recursively format all files in the current directory and sub-directories
In these commands, the -w flag instructs the tool to rewrite files in place, the -s instructs the tool to apply simplifications to the code where possible, and the -d flag instructs the tool to output diffs of the changes (because I'm curious to see what is changed). If you want to only display the names of changed files, instead of diffs, you can swap this for the -l flag instead.
The other formatting tool — go fmt — tool is a wrapper which essentially calls gofmt -l -w on a specified file or directory. You can use it like this:
$ go fmt ./...
Performing Static Analysis
The go vet tool carries out static analysis of your code and warns you of things which might be wrong with your code but wouldn't be picked up by the compiler. Issues like unreachable code, unnecessary assignments and badly-formed build tags. You can use it like so:
$ go vet foo.go     # Vet the foo.go file
$ go vet .          # Vet all files in the current directory
$ go vet ./...      # Vet all files in the current directory and sub-directories
$ go vet ./foo/bar  # Vet all files in the ./foo/bar directory
Behind the scenes, go vet runs a bunch of different analyzers which are listed here and you can disable specific ones on a case-by-case basis. For example to disable the composite analyzer you can use:
$ go vet -composites=false ./...
There are a couple of experimental analyzers in golang.org/x/tools which you might want to try: nilness (which checks for redundant or impossible nil comparisons) and shadow (which check for possible unintended shadowing of variables). If you want to use these, you'll need to install and run them separately. For example, to install nilness you would run:
$ cd /tmp
$ GO111MODULE=on go get golang.org/x/tools/go/analysis/passes/nilness/cmd/nilness
And you can then use it like so:
$ go vet -vettool=$(which nilness) ./...
-vettool flag is used it will only run the specified analyzer — all the other go vet analyzers won't be run.
Since Go 1.10 the go test tool automatically executes a small, high-confidence, subset of the go vet checks before running any tests. You can turn this behavior off when running tests like so:
$ go test -vet=off ./...
Linting Code
You can use the golint tool to identify style mistakes in your code. Unlike go vet, this isn't concerned with correctness of the code, but helps you to align your code with the style conventions in Effective Go and the Go Code Review Comments.
It's not part of the standard library, so you'll need to install it like so:
$ cd /tmp
$ GO111MODULE=on go get golang.org/x/lint/golint
You can then run it as follows:
$ golint foo.go     # Lint the foo.go file
$ golint .          # Lint all files in the current directory
$ golint ./...      # Lint all files in the current directory and sub-directories
$ golint ./foo/bar  # Lint all files in the ./foo/bar directory
Tidying and Verifying your Dependencies
Before you commit any changes to your code I recommend running the following two commands to tidy and verify your dependencies:
$ go mod tidy
$ go mod verify
The go mod tidy command will prune any unused dependencies from your go.mod and go.sum files, and update the files to include dependencies for all possible build tags/OS/architecture combinations (note: go run, go test, go build etc are ‘lazy' and will only fetch packages needed for the current build tags/OS/architecture). Running this before each commit will make it easier to determine which of your code changes were responsible for adding or removing which dependencies when looking at the version control history.
I also recommend using the go mod verify command to check that the dependencies on your computer haven't accidentally (or purposely) been changed since they were downloaded and that they match the cryptographic hashes in your go.sum file. Running this helps ensure that the dependencies being used are the exact ones that you expect, and any build for that commit will be reproducible at a later point.
Build and Deployment
Building an Executable
To compile a main package and create an executable binary you can use the go build tool. Typically I use it in conjunction with the -o flag, which let's you explicitly set the output directory and name of the binary like so:
$ go build -o=/tmp/foo .            # Compile the package in the current directory
$ go build -o=/tmp/foo ./cmd/foo    # Compile the package in the ./cmd/foo directory
In these examples, go build will compile the specified package (and any dependent packages), then invoke the linker to generate an executable binary, and output this to /tmp/foo.
It's important to note that, as of Go 1.10, the go build tool caches build output in the build cache. This cached output will be reused again in future builds where appropriate, which can significantly speed up the overall build time. This new caching behavior means that the old maxim of “prefer go install to go build to improve caching” no longer applies.
If you're not sure where your build cache is, you can check by running the go env GOCACHE command:
$ go env GOCACHE
/home/alex/.cache/go-build
Using the build cache comes with one important caveat — it does not detect changes to C libraries imported with cgo. So if your code imports a C library via cgo and you've made changes to it since the last build, you'll need to use the -a flag which forces all packages to be rebuilt. Alternatively, you could use go clean to purge the cache:
$ go build -a -o=/tmp/foo .     # Force all packages to be rebuilt
$ go clean -cache               # Remove everything from the build cache
If you're interested in what go build is doing behind the scenes, you might like to use the following commands:
$ go list -deps . | sort -u     # List all packages that are used to build the executable
$ go build -a -x -o=/tmp/foo .  # Rebuild everything and show the commands that are run
Finally, if you run go build on a non-main package, it will be compiled in a temporary location and again, the result will be stored in the build cache. No executable is produced.
Cross-Compilation
This is one of my favorite features of Go.
By default go build will output a binary suitable for use on your current operating system and architecture. But it also supports cross-compilation, so you can generate a binary suitable for use on a different machine. This is particularly useful if you're developing on one operating system and deploying on another.
You can specify the operating system and architecture that you want to create the binary for by setting the GOOS and GOARCH environment variables respectively. For example:
$ GOOS=linux GOARCH=amd64 go build -o=/tmp/linux_amd64/foo .
$ GOOS=windows GOARCH=amd64 go build -o=/tmp/windows_amd64/foo.exe .
To see a list of all supported OS/architecture combinations you can run go tool dist list:
$ go tool dist list
aix/ppc64
android/386
android/amd64
android/arm
android/arm64
darwin/386
darwin/amd64
...
For a bit more in-depth information about cross compilation I recommend reading this excellent post.
Using Compiler and Linker Flags
When building your executable you can use the -gcflags flag to change the behavior of the compiler and see more information about what it's doing. You can see a complete list of available compiler flags by running:
$ go tool compile -help
One flag that you might find interesting is -m, which triggers the printing of information about optimization decisions made during compilation. You can use it like this:
$ go build -gcflags="-m -m" -o=/tmp/foo . # Print information about optimization decisions
In the above example I used the -m flag twice to indicate that I want to print decision information two-levels deep. You can get simpler output by using just one.
Also, as of Go 1.10, compiler flags only apply to the specific packages passed to go build — which in the example above is the package in the current directory (represented by .). If you want to print optimization decisions for all packages including dependencies can use this command instead:
$ go build -gcflags="all=-m" -o=/tmp/foo .
As of Go 1.11, you should find it easier to debug optimized binaries than before. However, you can still use the flags -N to disable optimizations and -l to disable inlining if you need to. For example:
$ go build -gcflags="all=-N -l" -o=/tmp/foo . # Disable optimizations and inlining
You can see a list of available linker flags by running:
$ go tool link -help
Probably the most well-known of these is the -X flag, which allows you to "burn in" a (string) value to a specific variable in your application. This is commonly used to add a version number or commit hash. For example:
$ go build -ldflags="-X main.version=1.2.3" -o=/tmp/foo .
For more information about the -X flag and some sample code see this StackOverflow question and this post and this post.
You may also be interested in using the -s and -w flags to strip debugging information from the binary. This typically shaves about 25% off the final size. For example:
$ go build -ldflags="-s -w" -o=/tmp/foo . # Strip debug information from the binary
Diagnosing Problems and Making Optimizations
Running and Comparing Benchmarks
A nice feature of Go is that it makes it easy to benchmark your code. If you're not familiar with the general process for writing benchmarks there are good guides here and here.
To run benchmarks you'll need to use the go test tool, with the -bench flag set to a regular expression that matches the benchmarks you want to execute. For example:
$ go test -bench=. ./...                        # Run all benchmarks and tests
$ go test -run=^$ -bench=. ./...                # Run all benchmarks (and no tests)
$ go test -run=^$ -bench=^BenchmarkFoo$ ./...   # Run only the BenchmarkFoo benchmark (and no tests)
I almost always run benchmarks using the -benchmem flag, which forces memory allocation statistics to be included in the output.
$ go test -bench=. -benchmem ./...
By default, each benchmark test will be run for a minimum of 1 second, once only. You can change this with the -benchtime and -count flags:
$ go test -bench=. -benchtime=5s ./...       # Run each benchmark test for at least 5 seconds
$ go test -bench=. -benchtime=500x ./...     # Run each benchmark test for exactly 500 iterations
$ go test -bench=. -count=3 ./...            # Repeat each benchmark test 3 times over
If the code that you're benchmarking uses concurrency, you can use the -cpu flag to see the performance impact of changing your GOMAXPROCS value (essentially, the number of OS threads that can execute your Go code simultaneously). For example, to run benchmarks with GOMAXPROCS set to 1, 4 and 8:
$ go test -bench=. -cpu=1,4,8 ./...
To compare changes between benchmarks you might want to use the benchcmp tool. This isn't part of the standard go command, so you'll need to install it like so:
$ cd /tmp
$ GO111MODULE=on go get golang.org/x/tools/cmd/benchcmp
You can then use it like this:
$ go test -run=^$ -bench=. -benchmem ./... > /tmp/old.txt
# make changes
$ go test -run=^$ -bench=. -benchmem ./... > /tmp/new.txt
$ benchcmp /tmp/old.txt /tmp/new.txt
benchmark              old ns/op     new ns/op     delta
BenchmarkExample-8     21234         5510          -74.05%

benchmark              old allocs     new allocs     delta
BenchmarkExample-8     17             11             -35.29%

benchmark              old bytes     new bytes     delta
BenchmarkExample-8     8240          3808          -53.79%
Profiling and Tracing
Go makes it possible to create diagnostic profiles for CPU use, memory use, goroutine blocking and mutex contention. You can use these to dig a bit deeper and see exactly how your application is using (or waiting on) resources.
There are three ways to generate profiles:
- If you have a web application you can import the
net/http/pprofpackage. This will register some handlers with thehttp.DefaultServeMuxwhich you can then use to generate and download profiles for your running application. This post provides a good explanation and some sample code. - For other types of applications, you can profile your running application using the
pprof.StartCPUProfile()andpprof.WriteHeapProfile()functions. See theruntime/pprofdocumentation for sample code. - Or you can generate profiles while running benchmarks or tests by using the various
-***profileflags like so:
$ go test -run=^$ -bench=^BenchmarkFoo$ -cpuprofile=/tmp/cpuprofile.out .
$ go test -run=^$ -bench=^BenchmarkFoo$ -memprofile=/tmp/memprofile.out .
$ go test -run=^$ -bench=^BenchmarkFoo$ -blockprofile=/tmp/blockprofile.out .
$ go test -run=^$ -bench=^BenchmarkFoo$ -mutexprofile=/tmp/mutexprofile.out .
Using the -***profile flags when running benchmarks or tests will result in a test binary being outputted to your current directory. If you want to output this to an alternative location you should use the -o flag like so:
$ go test -run=^$ -bench=^BenchmarkFoo$ -o=/tmp/foo.test -cpuprofile=/tmp/cpuprofile.out .
Whichever way you choose to create a profile, when profiling is enabled your Go program will stop about 100 times per second and take a snapshot at that moment in time. These samples are collected together to form a profile that you can analyze using the pprof tool.
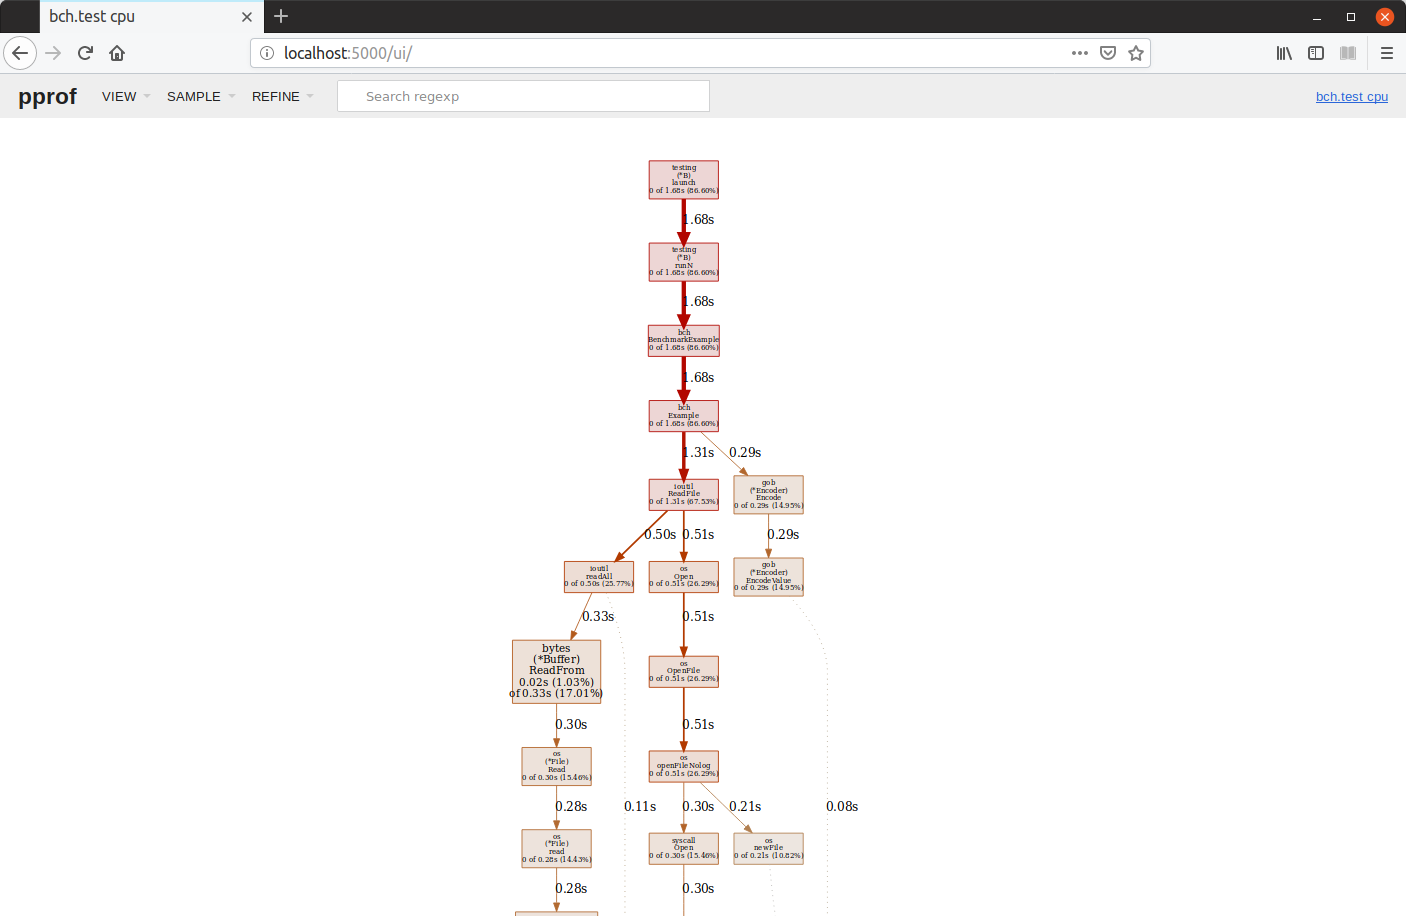
My favourite way to inspect a profile is to use the go tool pprof -http command to open it in a web browser. For example:
$ go tool pprof -http=:5000 /tmp/cpuprofile.out
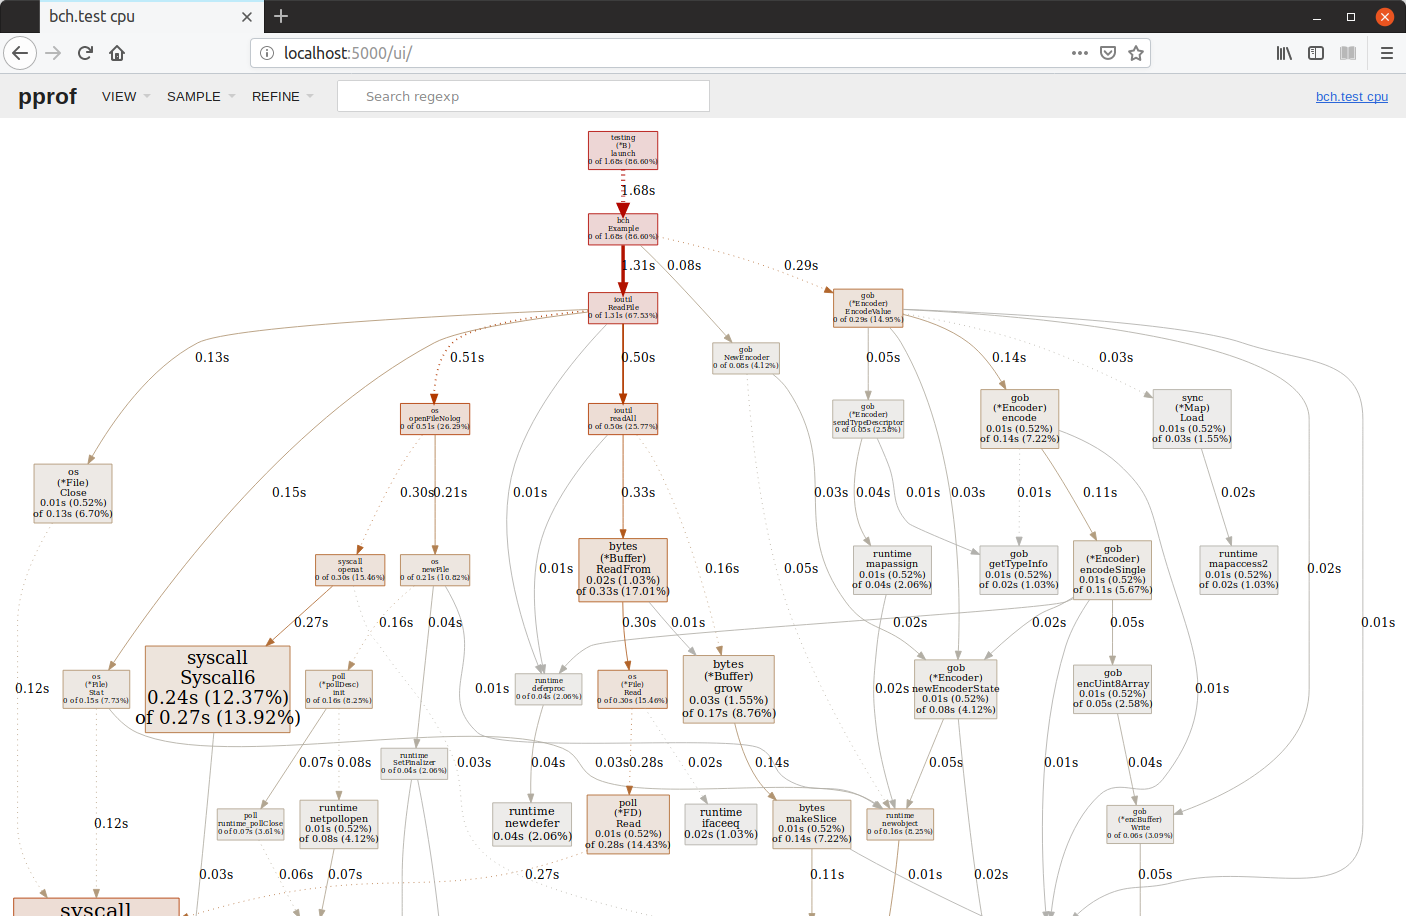
This will default to displaying a graph showing the execution tree for the sampled aspects of your application, which makes it possible to quickly get a feel for any resource usage 'hotspots'. In the graph above, we can see that the hotspots in terms of CPU usage are two system calls originating from ioutil.ReadFile().
You can also navigate to other views of the profile including top usage by function and source code.
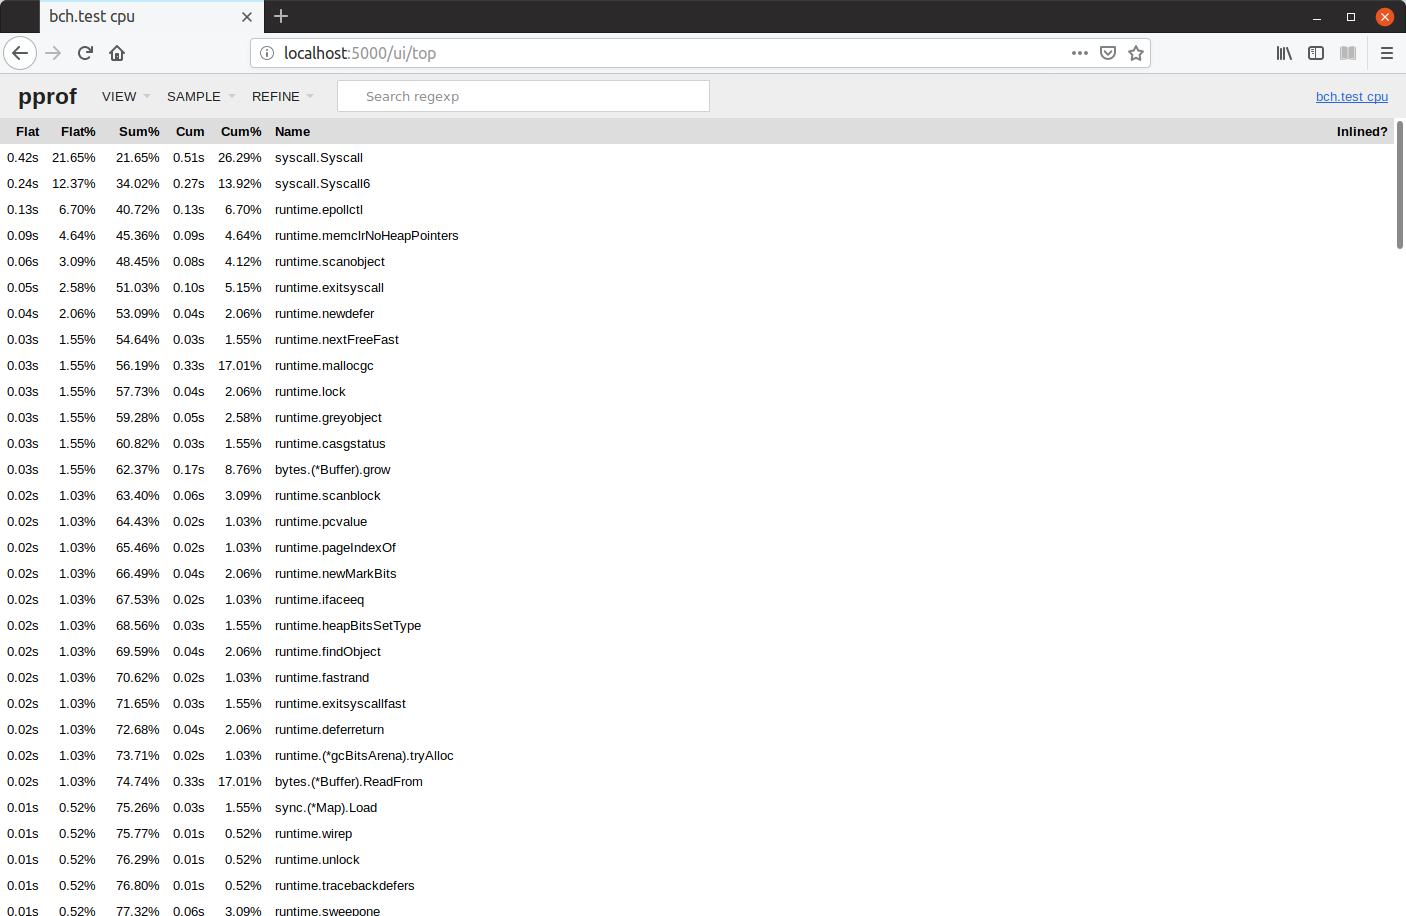
If the amount of information is overwhelming, you might want to use the --nodefraction flag to ignore nodes that account for less than a certain percentage of samples. For example to ignore nodes that use appear in less than 10% of samples you can run pprof like so:
$ go tool pprof --nodefraction=0.1 -http=:5000 /tmp/cpuprofile.out
This makes the graph a lot less 'noisy' and if you zoom in on this screenshot, it's now much clearer to see and understand where the CPU usage hotspots are.
Profiling and optimizing resource usage is big, nuanced, topic and I've barely scratched the surface here. If you're interested in knowing more then I encourage you to read the following blog posts:
- Profiling and optimizing Go web applications
- Debugging performance issues in Go programs
- Daily code optimization using benchmarks and profiling
- Profiling Go programs with pprof
Another tool that you can use to help diagnose issues is the runtime execution tracer. This gives you a view of how Go is creating and scheduling goroutines to run, when the garbage collector is running, and information about blocking syscall/network/sync operations.
Again, you can generate trace from your tests or benchmarks, or use net/http/pprof to create and download a trace for your web application. You can then use go tool trace to view the output in your web browser like so:
$ go test -run=^$ -bench=^BenchmarkFoo$ -trace=/tmp/trace.out .
$ go tool trace /tmp/trace.out
Important: This is currently only viewable in Chrome/Chromium.
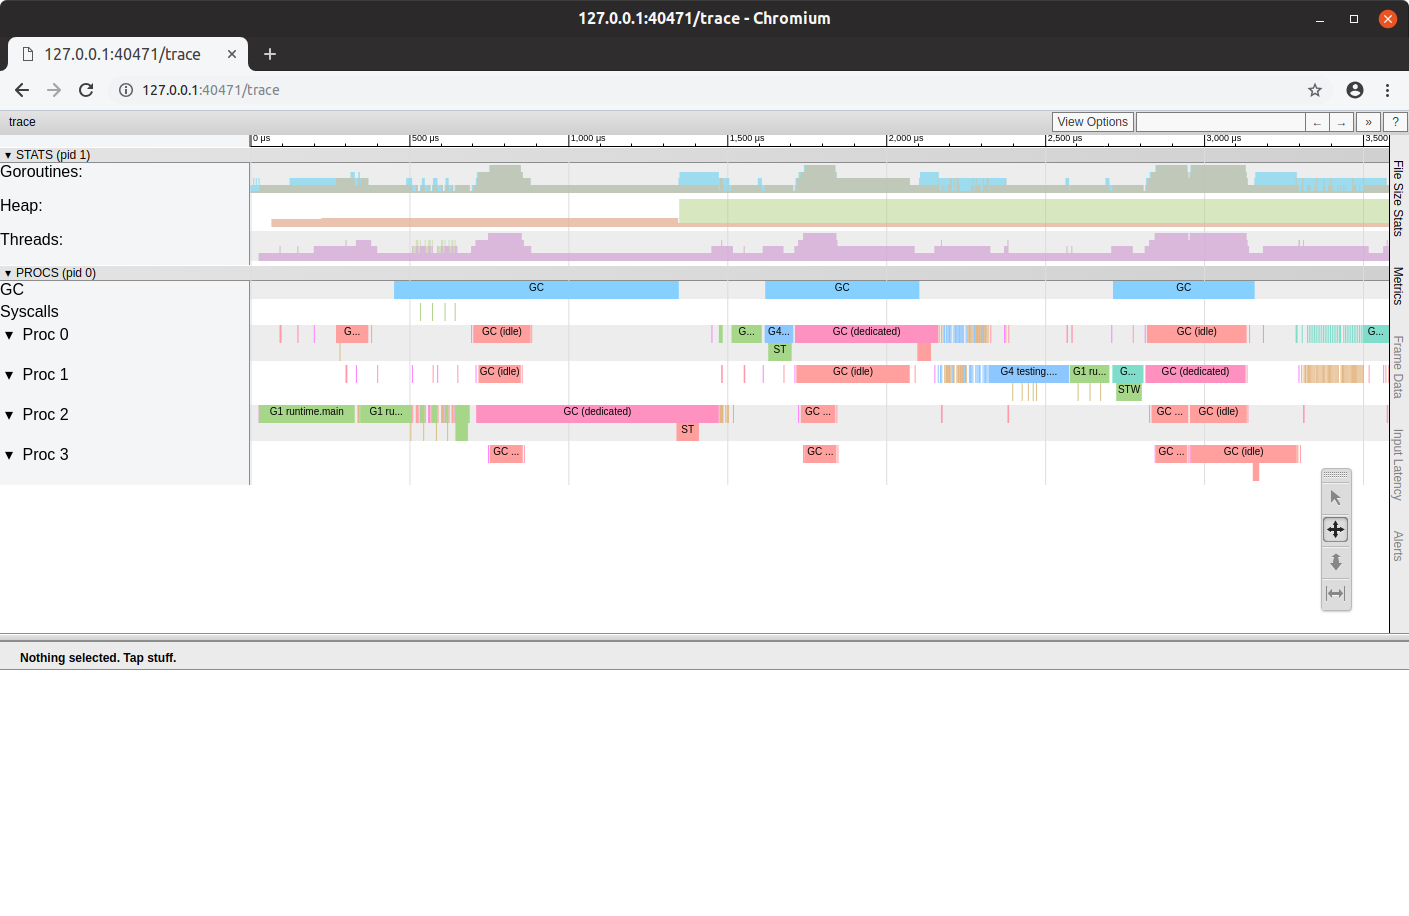
For more information about Go's execution tracer and how to interpret the output please see Rhys Hiltner's dotGo 2016 talk and this excellent blog post.
Checking for Race Conditions
I talked earlier about enabling Go's race detector during tests by using go test -race. But you can also enable it for running programs when building a executable, like so:
$ go build -race -o=/tmp/foo .
It's critical to note that race-detector-enabled binaries will use more CPU and memory than normal, so you shouldn't use the -race flag when building binaries for production under normal circumstances.
But you may want to deploy a race-detector-enabled binary on one server within a pool of many. Or use it to help track down a suspected race-condition by using a load-test tool to throw traffic concurrently at a race-detector-enabled binary.
By default, if any races are detected while the binary is running a log will be written to stderr. You can change this by using the GORACE environment variable if necessary. For example, to run the binary located at /tmp/foo and output any race logs to /tmp/race.<pid> you can use:
$ GORACE="log_path=/tmp/race" /tmp/foo
Managing Dependencies
You can use the go list tool to check whether a specific dependency has a newer version available like so:
$ go list -m -u github.com/alecthomas/chroma
github.com/alecthomas/chroma v0.6.2 [v0.6.3]
This will output the dependency name and version that you're currently using, followed by the latest version in square brackets [], if a newer one exists. You can also use go list to check for updates to all dependencies (and sub-dependencies) like so:
$ go list -m -u all
You can upgrade (or downgrade) a dependency to the latest version, specific tagged-release or commit hash with the go get command like so:
$ go get github.com/foo/bar@latest
$ go get github.com/foo/[email protected]
$ go get github.com/foo/bar@7e0369f
If the dependency you're updating has a go.mod file, then based on the information in this go.mod file, updates to any sub-dependencies will also be downloaded if necessary. If you use the go get -u flag, the contents of the go.mod file will be ignored and all sub-dependencies will be upgraded to their latest minor/patch version… even if the go.mod specifies a different version.
After upgrading or downgrading any dependencies it's a good idea to tidy your modfiles. And you might also want to run the tests for all packages to help check for incompatibilities. Like so:
$ go mod tidy
$ go test all
Occasionally you might want to use a local version of a dependency (for example, you need to use a local fork until a patch is merged upstream). To do this, you can use the go mod edit command to replace a dependency in your go.mod file with a local version. For example:
$ go mod edit -replace=github.com/alexedwards/argon2id=/home/alex/code/argon2id
This will add a replace rule to your go.mod file like so, and any future invocations of go run, go build etc will use the local version.
module alexedwards.net/example

go 1.12

require github.com/alexedwards/argon2id v0.0.0-20190109181859-24206601af6c

replace github.com/alexedwards/argon2id => /home/alex/Projects/playground/argon2id
Once it's no longer necessary, you can remove the replace rule with the command:
$ go mod edit -dropreplace=github.com/alexedwards/argon2id
You can use the same general technique to import packages that exist only on your own file system. This can be useful if you're working on multiple modules in development at the same time, one of which depends on the other.
Upgrading to a New Go Release
The go fix tool was originally released back in 2011 (when regular changes were still being made to Go's API) to help users automatically update their old code to be compatible with the latest version of Go. Since then, Go's compatibility promise means if you're upgrading from one Go 1.x version to a newer 1.x version everything should Just Work and using go fix should generally be unnecessary.
However, there are a handful of very specific issues that it does deal with. You can see a summary of them by running go tool fix -help. If you decide that you want or need to run go fix after upgrading, you should you run the following command, then inspect a diff of the changes before you commit them.
$ go fix ./...
Reporting Bugs
If you're confident that you've found an unreported issue with Go's standard library, tooling or documentation, you can use the go bug command to create a new GitHub issue.
$ go bug
This will open a browser window containing an issue pre-filled with your system information and reporting template.
Cheatsheet
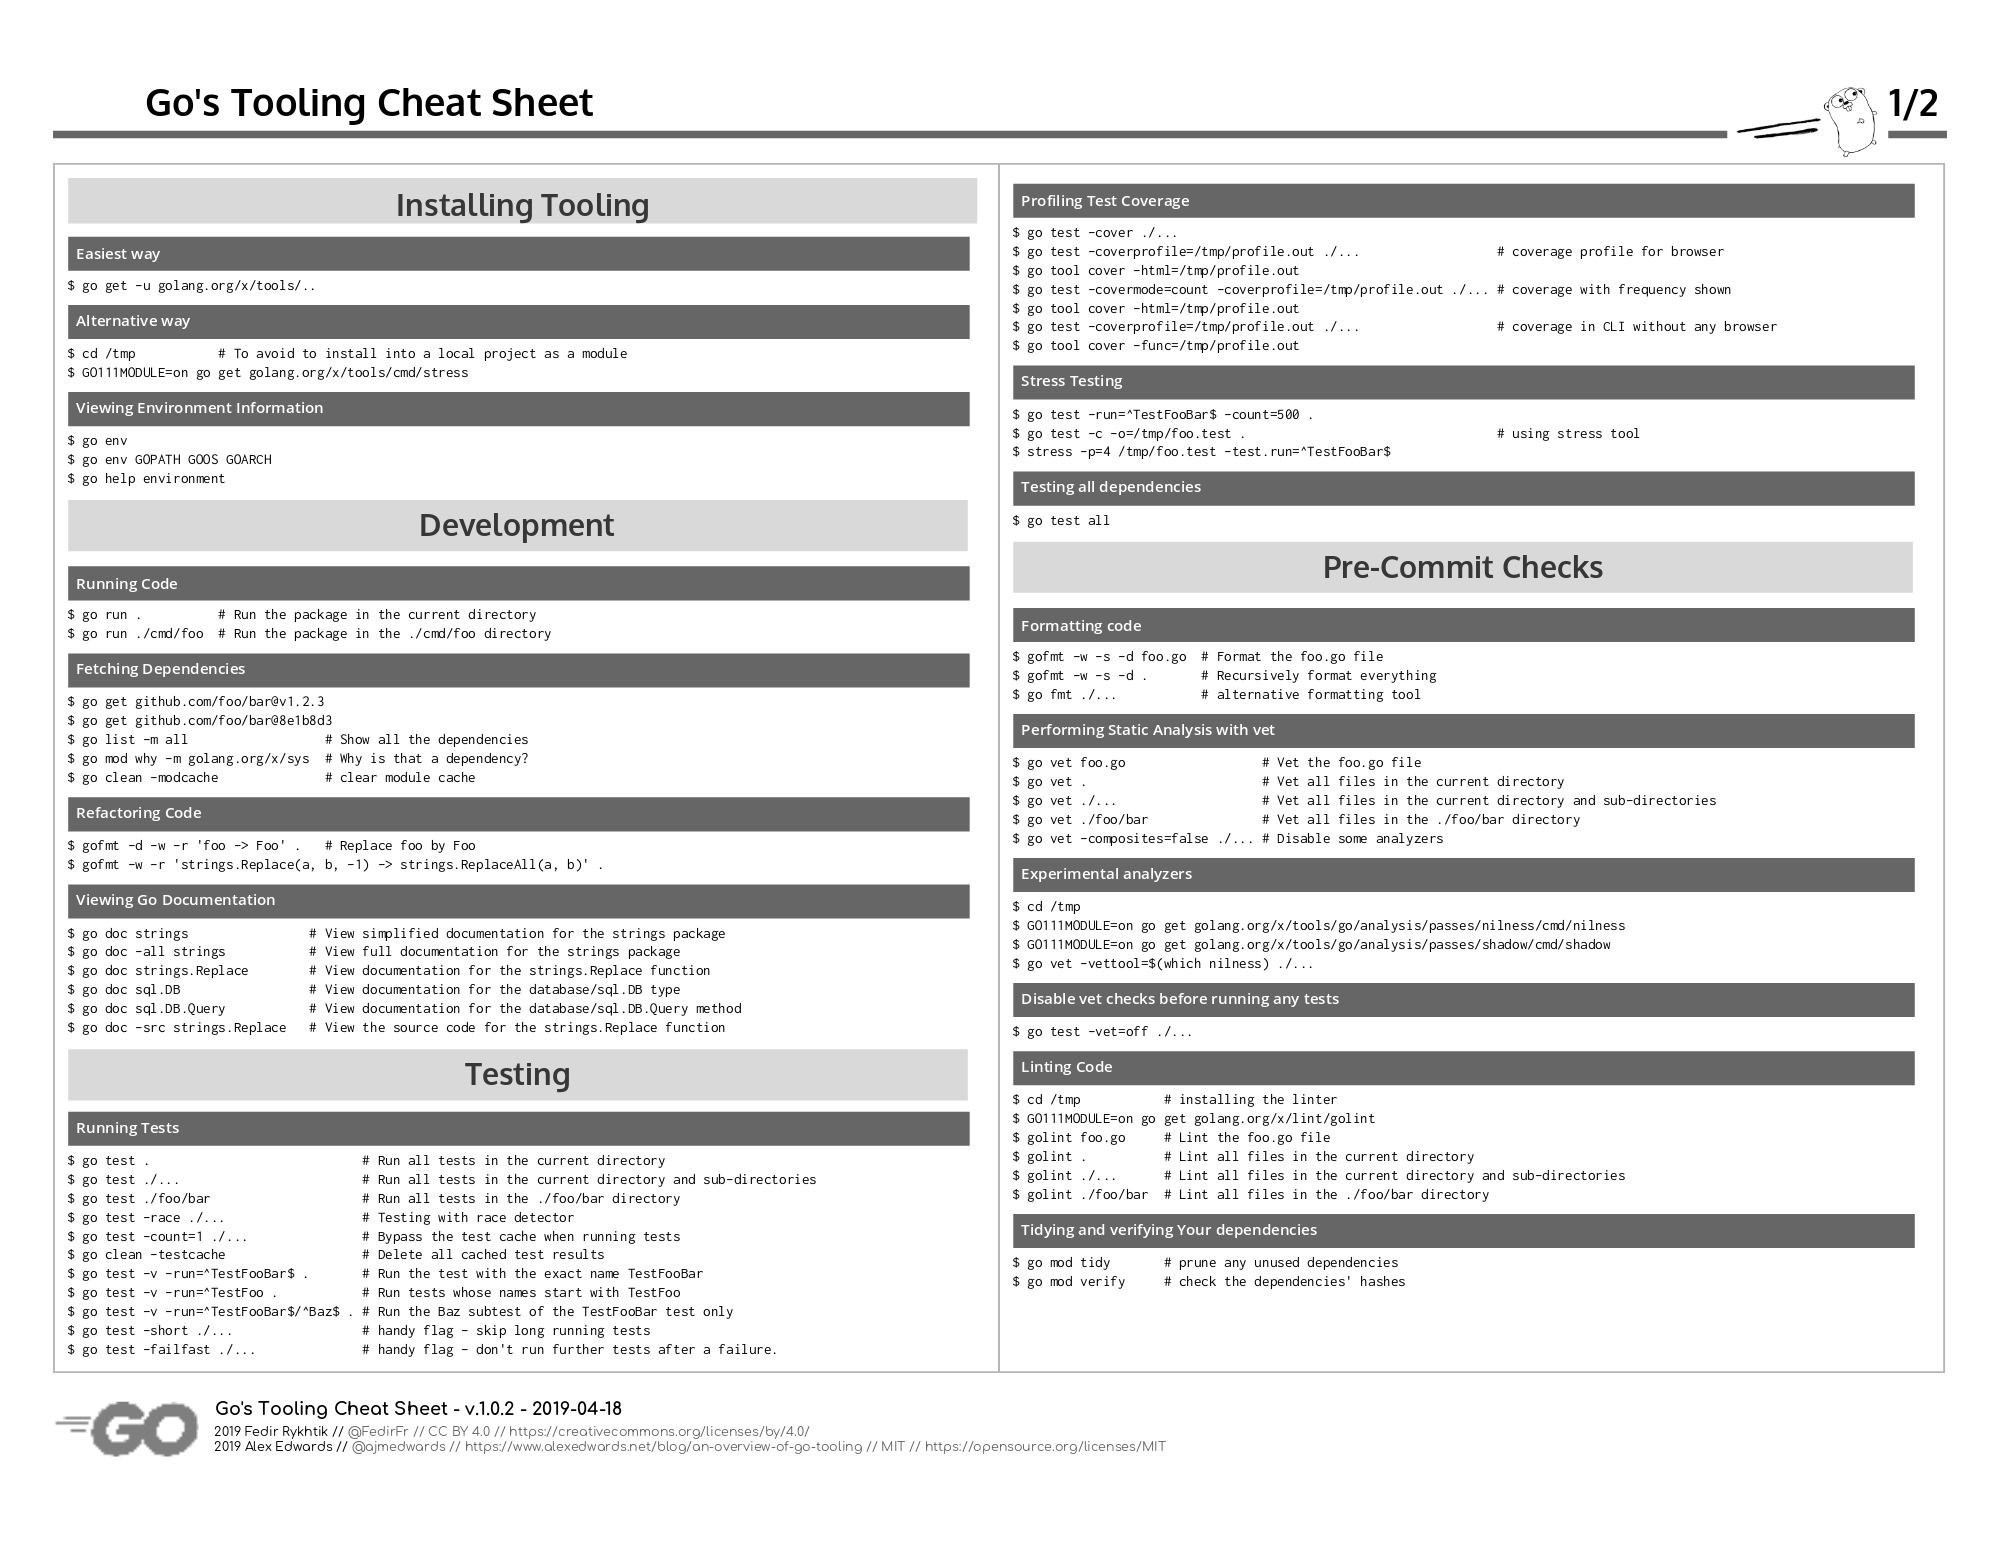
Update 2019-04-19: @FedirFR has kindly made a cheatsheet based on this post. You can download it here.
If you enjoyed this post...
You might like to check out my other Go tutorials on this site, or if you're after something more structured, my books Let's Go and Let's Go Further cover how to build complete, production-ready, web apps and APIS with Go.